Most operations waste electricity.
Not with Hybird OS.
Per-device electricity insight, AI-driven guidance, automated shut-down and ESG Scope 2 data, billed only on the savings we deliver.
Saving electricity for restaurants.
What you get
Six drivers that compound into measurable savings.
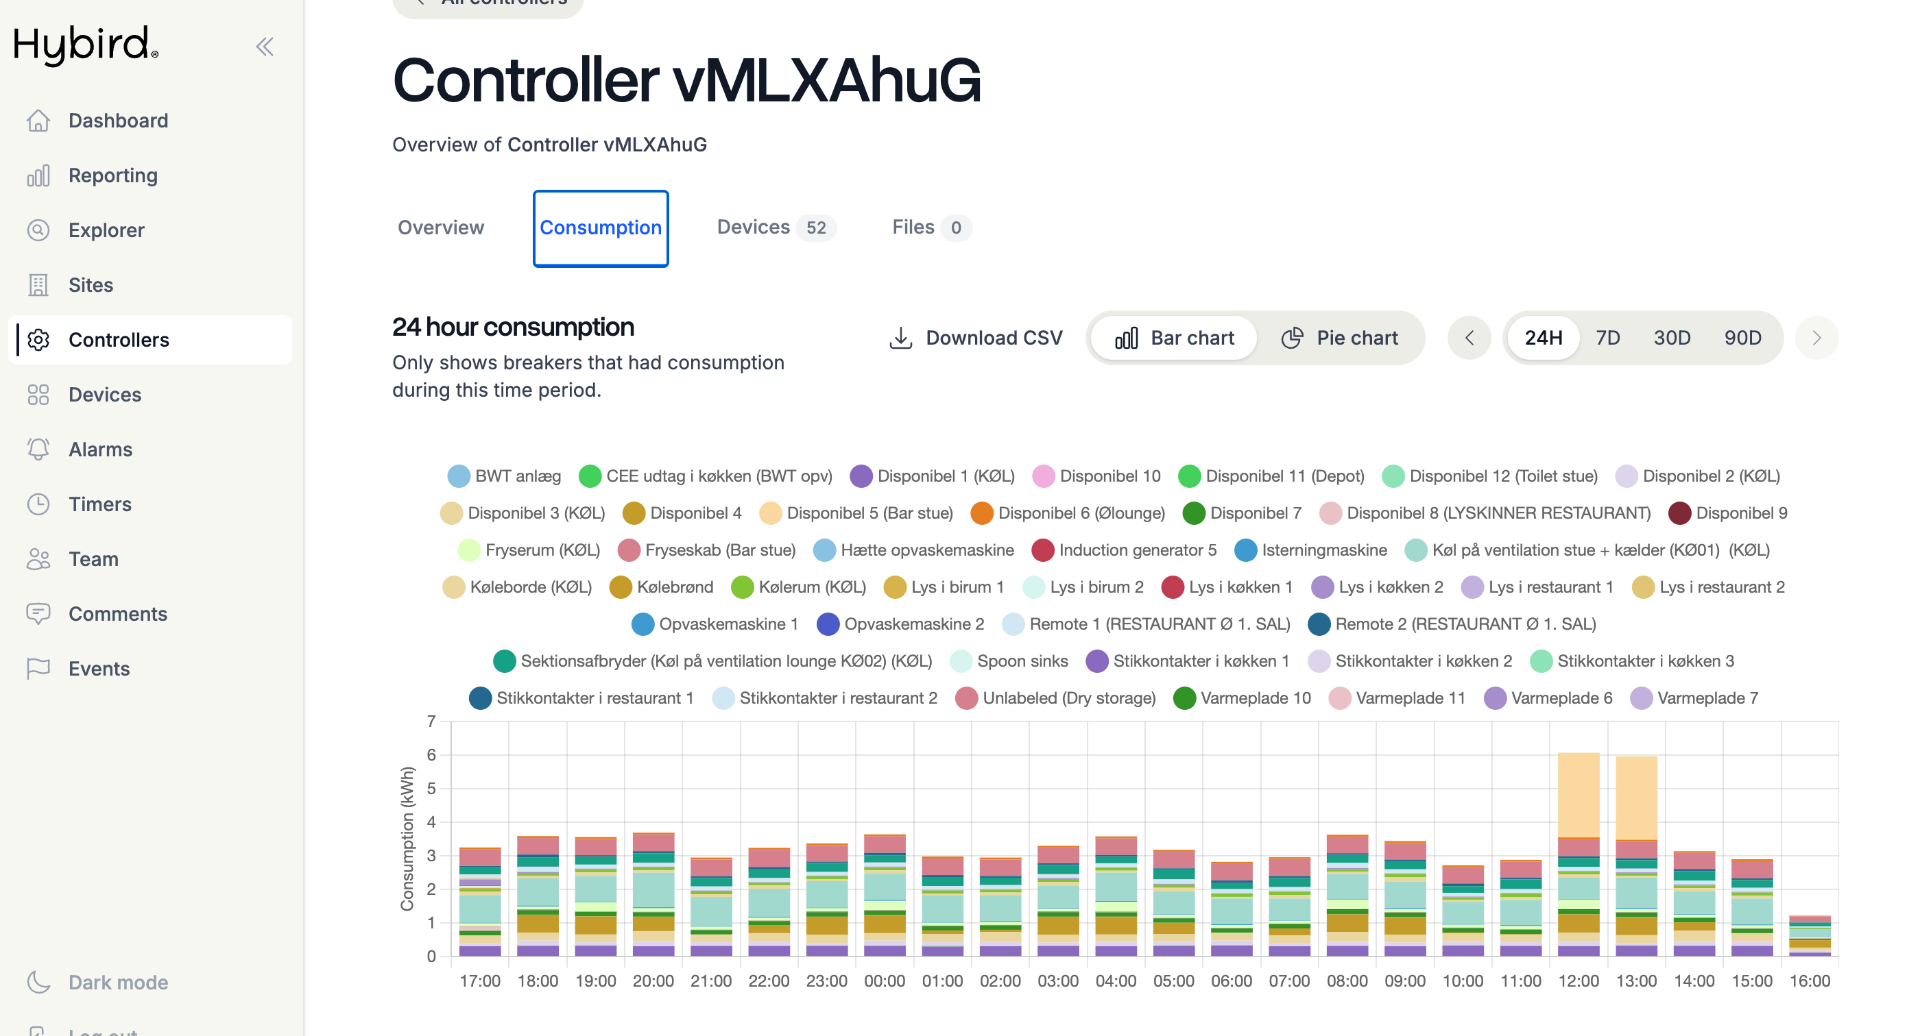
Discover what drives your consumption
Electricity data on every device. Granular insight at every machine, light, fridge, screen and appliance, not just the meter.
Cut electricity waste
Smart automatic timers. Suggested shut-down windows per circuit, calibrated against your opening hours and historical use.
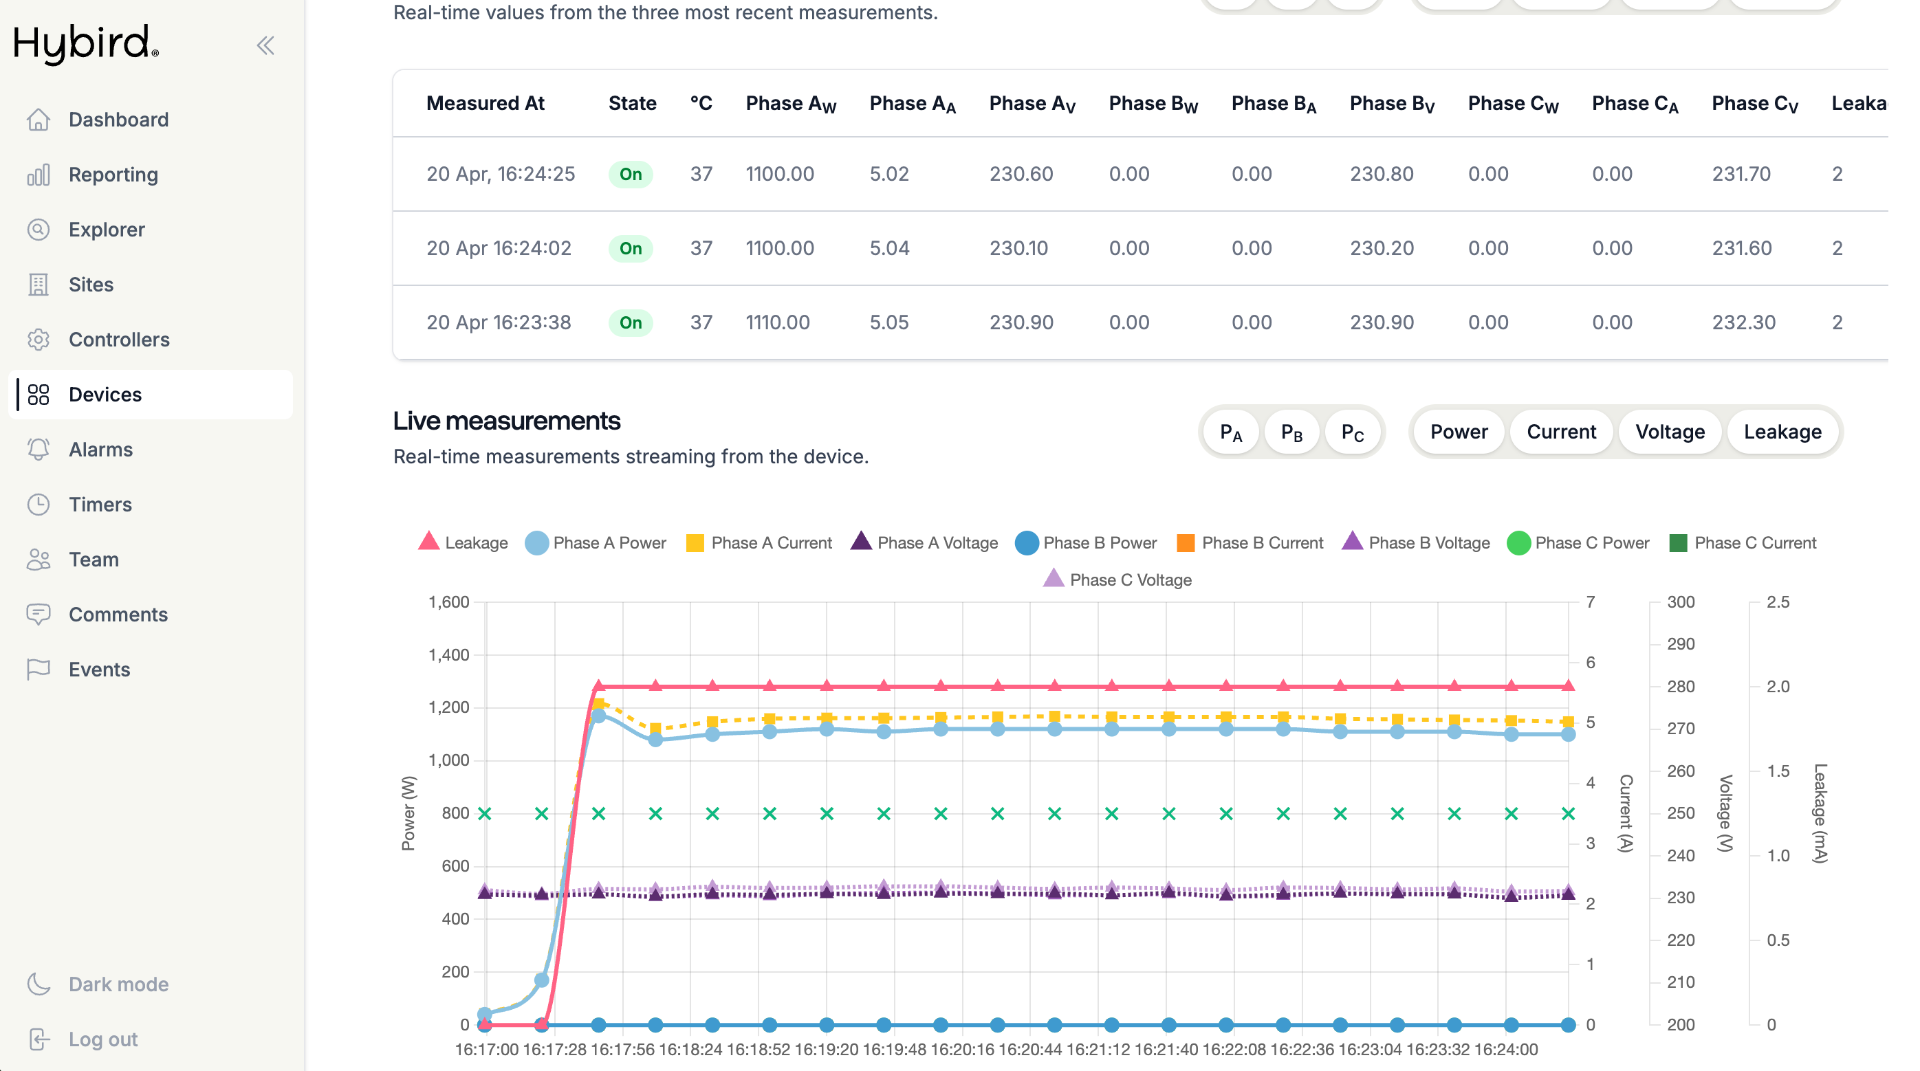
Protect uptime before things break
Fault detection and uptime. Early warning for leakage current and temperature deviations, before equipment fails.
Your always-on energy consultant
Automated AI guidance. Hybird OS continuously analyses your operations, pinpoints where electricity is being wasted and executes on the fix automatically.
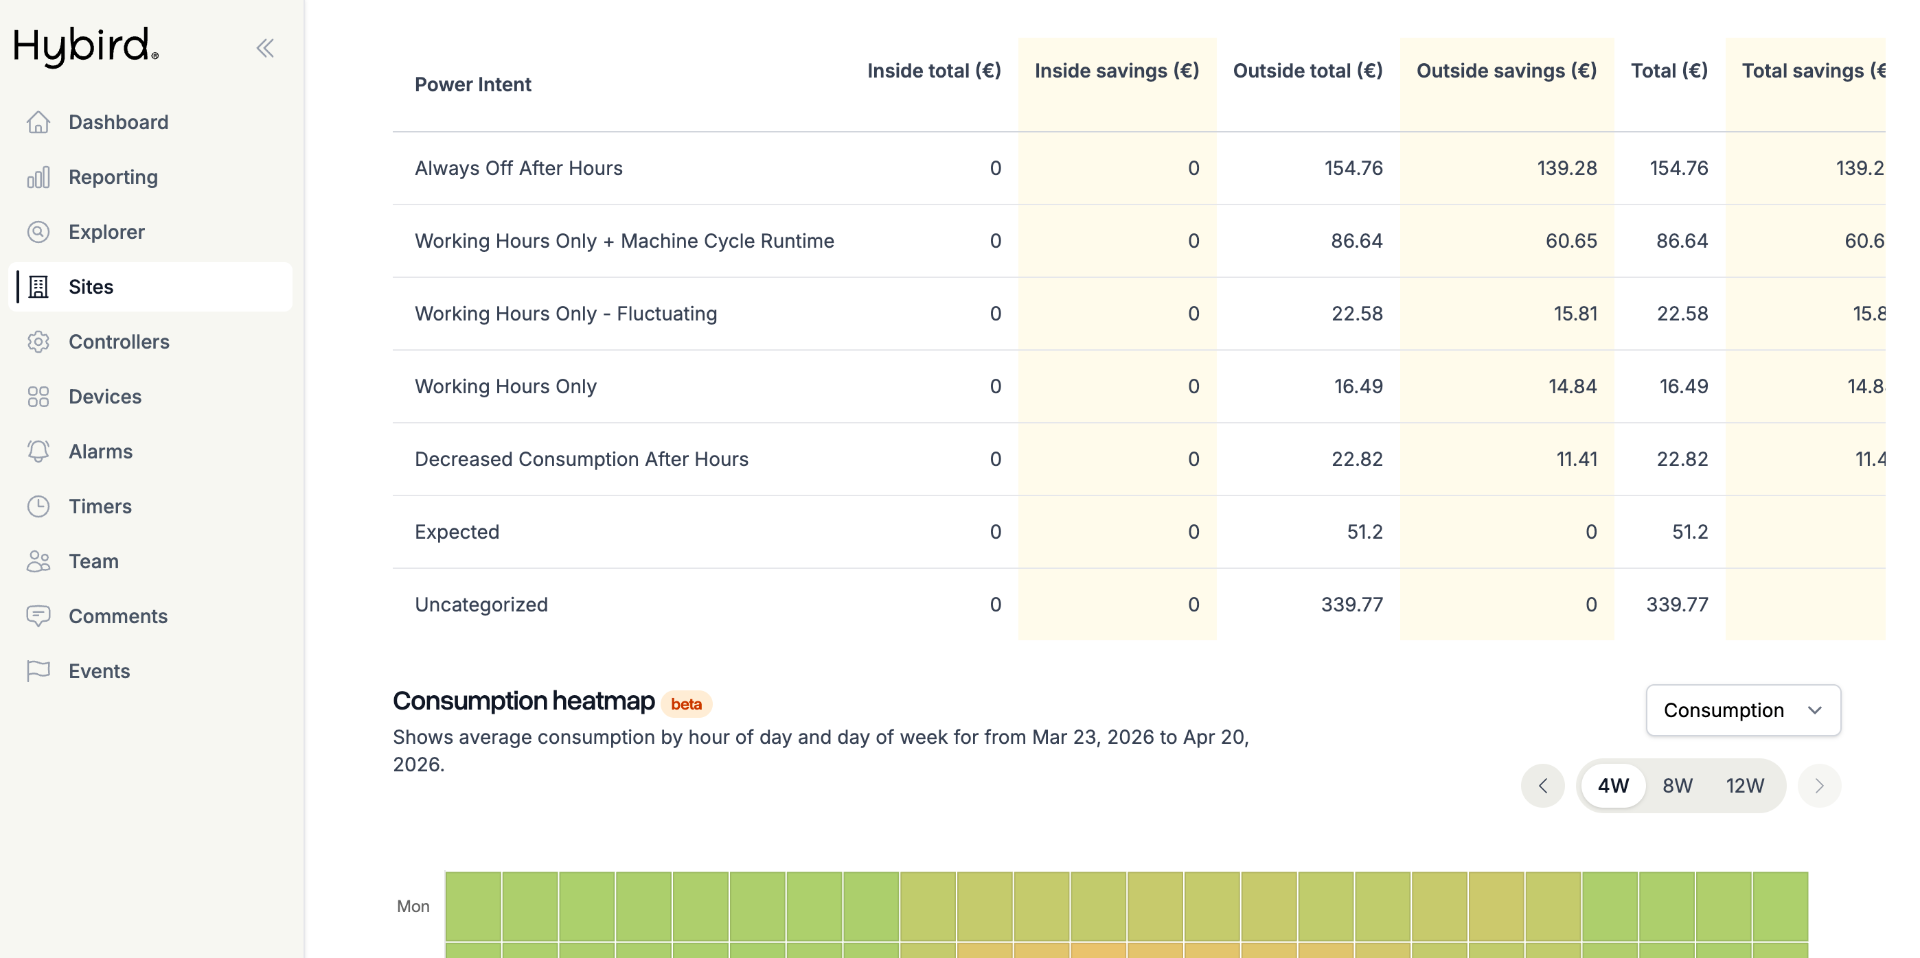
Pass audits without the spreadsheet scramble
ESG Scope 2, export-ready. Audit-grade Scope 2 data straight to API, CSV or your reporting tool of choice.
One reference point for all electricity operations
Personalised live domain. Every customer gets a private domain showing all electricity activity in real time.
Product
Hardware + data + software + automation = Hybird OS
The Hybird breaker and core controller sit inside your switchboard, paired with a smart energy meter at the supply. Together they measure every circuit at sub-second resolution and stream live data into your private dashboard.
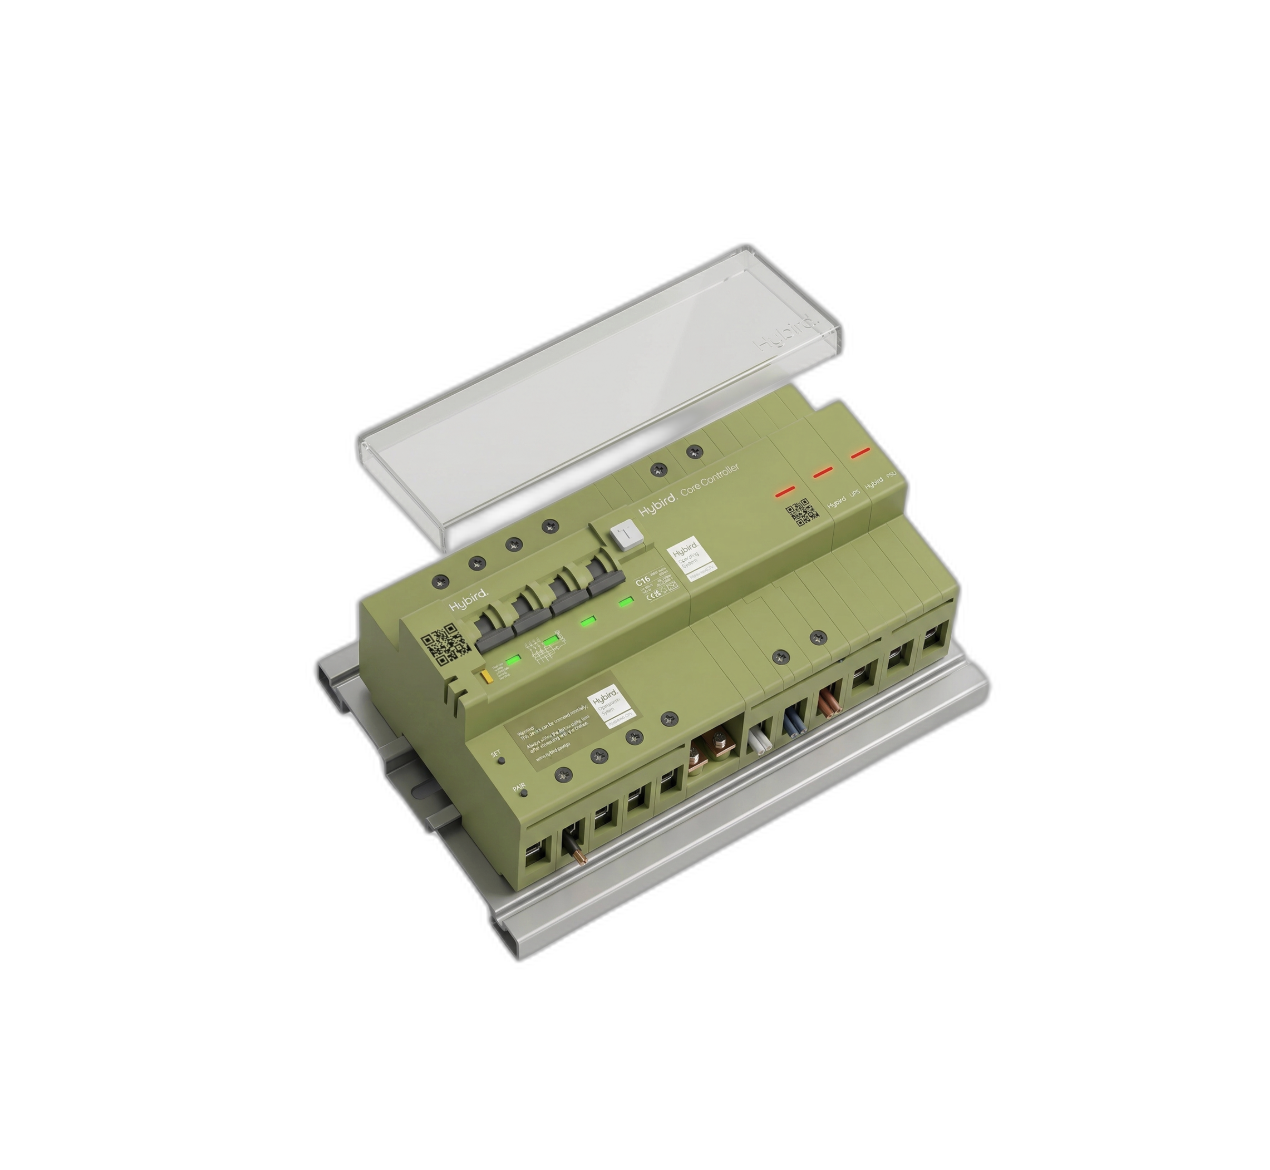
Breaker + Core Controller
Intelligent breaker with embedded CPU paired with a Core Controller running Hybird OS. Built-in UPS and PSU, safety lock, remote operation and per-circuit sub-second measurement, streaming live data to your dashboard.
Software
Live load
42.6kW
Today
318kWh
Saved Q
21%
Consumption, last 24h
Circuits
Hybird OS software; automation and insights
Customer cases
Real operations. Real savings.
Three live deployments showing where the savings actually come from, and how much.

Restaurant
24%
Lighting, kitchen appliances and ventilation running outside service hours, eliminated without touching the operation.
- Lighting
- Kitchen appliances
- Ventilation

Logistics
35%
Stand-by power across loading bays, perimeter lighting and electrical heating, automated to follow actual shift patterns.
- Stand-by power
- Compressors
- Electrical heating

Manufacturing
30%+
Idle machinery, ventilation and lighting consuming electricity around the clock, shut down outside production windows.
- Stand-by machinery
- Ventilation
- Lighting
Your private domain
Every site, every device, every kWh, in real time.
Every Hybird customer receives a personalised domain showing all electricity activity across all sites. Drill from portfolio level down to a single circuit in two clicks.
Pricing
Hybird OS Optimisation.
We make money when you save money. No hidden fees, no upfront software cost.
Hardware typically pays for itself in under a year. Everything after that is pure savings.
Hardware installation
Hybird breakers + controllers
Priced in line with standard commercial breakers. Depends on your existing installation, confirmed after site assessment.
Standard breaker price
Per breaker, one-off
Software activation
Hybird OS access
Activates your software, keeps the AI optimiser running and ESG export active.
49 DKK
Per month, per site, billed annually
Performance
Savings share
We charge a share of the electricity savings we deliver, billed quarterly against your measured baseline. No savings, no charge.
30%
Of measured savings, quarterly
Billing model
Hybird billing model
How savings are measured and invoiced — illustrated with a fictive customer site.
Weeks 1–3
Baseline
Month 1–3
Triggers live
After Q1
Verify & invoice
Ongoing
Prepay next Q
Customer baseline — annual consumption
Annual kWh
100,000
Annual cost
200,000
DKK
Rate
2.00
DKK / kWh
Hybird fee
30%
of verified savings
Quarterly breakdown
Q3 — first invoice after verification
Actual savingsImplementation process
From first site visit to live savings, in weeks.
Identify relevant site(s)
Hybird site visit: specs scope
Order confirmed
Installation
Software activation
Live savings
1 week
Arrange with site manager
3 days
1-3 weeks
1 week
Instantly
Activate agreed timers
15-30%
Typical site optimisation
1 week
Identify relevant site(s)
Arrange with site manager
3 days
Hybird site visit: specs scope
1-3 weeks
Order confirmed
1 week
Installation
Instantly
Software activation
Activate agreed timers
Live savings
15-30%
Typical site optimisation after activation
Next step
Let's talk.
Book an intro meeting with Patrick to walk through pricing and expected savings. From there, we can arrange a site visit to scope the installation for your sites.